Backtest support line bounce based indicator accuracy
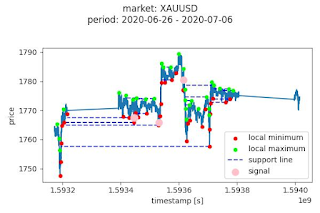
If need setup assistance leave a comment below, or send a message via Request Service form. Sections Intro Revised Accuracy (updated at 13.10.2022, 21.10.2022) Idea behind expert advisor and experimenting with dataset Support line indicator is based on repetitive extremum points. If say few times in a row price has dropped at some value and then got up. That value is defined as support line. It's likely that it comes close to support line again the pattern will repeat. We are to place an order when this occurs. Stop loss equals support line value. Take profit equals +1% of the entry price. To avoid amount of false positives, we are to use some extra margin like 0.1% during comparisons. So that if price fluctuates around support line +-0.1% we are to wait, until it is either <-0.1% or >0.1% to take the action. If the value drops below support line, indicator didn't work in this case. Otherwise, we are placing an order...