Backtest support line bounce based indicator accuracy
Idea behind expert advisor and experimenting with dataset
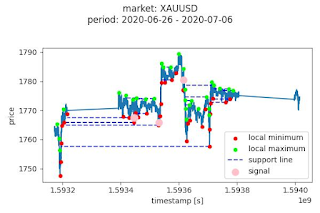
Support line indicator is based on repetitive extremum points. If say few times in a row price has dropped at some value and then got up. That value is defined as support line. It's likely that it comes close to support line again the pattern will repeat. We are to place an order when this occurs. Stop loss equals support line value. Take profit equals +1% of the entry price. To avoid amount of false positives, we are to use some extra margin like 0.1% during comparisons. So that if price fluctuates around support line +-0.1% we are to wait, until it is either <-0.1% or >0.1% to take the action. If the value drops below support line, indicator didn't work in this case. Otherwise, we are placing an order. To further reduce false positives few times is defined as 3 times, or any other positive number. It can be adjusted later on based on backtest results. But it's not good to optimize all of the indicator constants to avoid over fitting.
Let's backtest the strategy on 10 markets for the last 2 years. We are to estimate amount of correct predictions, incorrect ones, as well as final profit considering each trade is being executed in a all in manner.
    market order_type       acc all_in_balance  total_trades       start         end
 0  XAUUSD        buy   19.14 %       15.775 %           653  2020-06-26  2022-06-24
 1  EURUSD        buy   14.34 %       -7.973 %           258  2020-06-26  2022-07-01
 2  GBPUSD        buy   19.76 %       14.677 %           420  2020-06-26  2022-07-01
 3  USDCAD        buy   15.93 %       -3.975 %           339  2020-06-26  2022-07-01
 4  USDJPY        buy   16.23 %       -2.046 %           228  2020-06-26  2022-07-01
 5  FCHI40        buy   16.30 %       -7.112 %           454  2020-09-23  2022-07-01
 6  GDAXIm        buy   14.24 %      -15.743 %           316  2020-09-23  2022-07-01
 7   HSI50        buy   14.45 %      -10.783 %           339  2020-09-23  2022-07-01
 8   NI225        buy   18.81 %        7.834 %           404  2020-09-23  2022-07-01
 9  SP500m        buy   18.45 %        6.378 %           412  2020-09-23  2022-07-01
 |
| Fig 1. Good example, XAUUSD market |
 |
| Fig 2. Good example, EURUSD market |
 |
| Fig 3. Good example, FCHI40 market |
 |
| Fig 4. Good example, HSI50 market |
 |
| Fig 5. Bad example, USDCAD market, indicator is not profitable here |
 |
| Fig 6. Bad example, need constants readjustment, lots of false positives |
Let's apply another regularization. We are to limit support line extremum points. They are to be apart no more than +-50% from the mean distance among them.
    market order_type       acc all_in_balance  total_trades       start         end
 0  XAUUSD        buy   21.36 %       -9.852 %           337  2020-06-26  2022-06-24
 1  EURUSD        buy   24.09 %        1.245 %           137  2020-06-26  2022-07-01
 2  GBPUSD        buy   24.08 %        1.964 %           191  2020-06-26  2022-07-01
 3  USDCAD        buy   18.45 %      -10.221 %           168  2020-06-26  2022-07-01
 4  USDJPY        buy   29.77 %       11.619 %           131  2020-06-26  2022-07-01
 5  FCHI40        buy   24.19 %        0.795 %           186  2020-09-23  2022-07-01
 6  GDAXIm        buy   24.66 %        2.217 %           146  2020-09-23  2022-07-01
 7   HSI50        buy   22.52 %       -2.928 %           151  2020-09-23  2022-07-01
 8   NI225        buy   25.15 %        3.014 %           163  2020-09-23  2022-07-01
 9  SP500m        buy   19.41 %       -8.652 %           170  2020-09-23  2022-07-01
    market order_type       acc all_in_balance  total_trades       start         end
 0  XAUUSD       sell   19.72 %      -13.666 %           284  2020-06-26  2022-06-24
 1  EURUSD       sell   25.17 %        3.820 %           143  2020-06-26  2022-07-01
 2  GBPUSD       sell   23.50 %        0.839 %           200  2020-06-26  2022-07-01
 3  USDCAD       sell   26.83 %        8.297 %           164  2020-06-26  2022-07-01
 4  USDJPY       sell   19.70 %       -5.844 %           132  2020-06-26  2022-07-01
 5  FCHI40       sell   18.90 %       -9.813 %           164  2020-09-23  2022-07-01
 6  GDAXIm       sell   20.83 %       -6.834 %           144  2020-09-23  2022-07-01
 7   HSI50       sell   26.00 %        3.852 %           150  2020-09-23  2022-07-01
 8   NI225       sell   22.62 %       -1.135 %           168  2020-09-23  2022-07-01
 9  SP500m       sell   25.14 %        4.588 %           175  2020-09-23  2022-07-01
Past bounces should have take profit not less than 1%. This optimization should exhibit ~50% accuracy for the indicator. Cause chances to hit below or higher than mean are 50/50 for a gaussian distribution. Backtest results do not support the hypothesis though.
    market order_type       acc all_in_balance  total_trades       start         end
 0  XAUUSD        buy   24.00 %       -0.144 %            25  2020-06-26  2022-06-24
 1  EURUSD        buy   40.00 %        1.078 %             5  2020-06-26  2022-07-01
 2  GBPUSD        buy    0.00 %       -0.611 %             2  2020-06-26  2022-07-01
 3  USDCAD        buy   12.50 %       -1.072 %             8  2020-06-26  2022-07-01
 4  USDJPY        buy   40.00 %        1.063 %             5  2020-06-26  2022-07-01
 5  FCHI40        buy   22.22 %       -0.509 %            27  2020-09-23  2022-07-01
 6  GDAXIm        buy   31.25 %        1.074 %            16  2020-09-23  2022-07-01
 7   HSI50        buy   25.00 %        0.634 %            16  2020-09-23  2022-07-01
 8   NI225        buy   36.00 %        4.112 %            25  2020-09-23  2022-07-01
 9  SP500m        buy   12.50 %       -2.281 %            16  2020-09-23  2022-07-01
    market order_type       acc all_in_balance  total_trades       start         end
 0  XAUUSD       sell   36.84 %        2.771 %            19  2020-06-26  2022-06-24
 1  EURUSD       sell   28.57 %        0.495 %             7  2020-06-26  2022-07-01
 2  GBPUSD       sell   11.11 %       -1.406 %             9  2020-06-26  2022-07-01
 3  USDCAD       sell    0.00 %       -0.308 %             1  2020-06-26  2022-07-01
 4  USDJPY       sell    0.00 %       -0.605 %             2  2020-06-26  2022-07-01
 5  FCHI40       sell   13.04 %       -3.301 %            23  2020-09-23  2022-07-01
 6  GDAXIm       sell   24.14 %       -0.075 %            29  2020-09-23  2022-07-01
 7   HSI50       sell   30.77 %        1.463 %            13  2020-09-23  2022-07-01
 8   NI225       sell   21.43 %       -0.628 %            28  2020-09-23  2022-07-01
 9  SP500m       sell   27.27 %        1.006 %            22  2020-09-23  2022-07-01
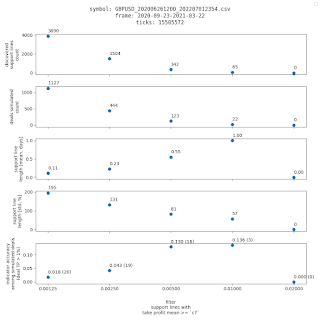
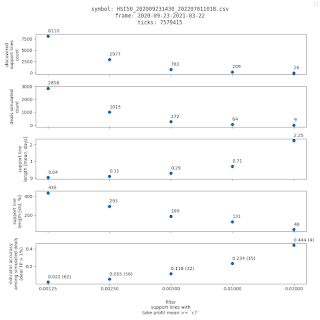
New discoveries behind the algorithm. Unexpected results after the alterations.

|

|

|

|

|

|

|

|

|

|
||
|
Fig 6. XAUUSD, EURUSD, SP500, GBPUSD, USDCAD, USDJPY, FCHI40, GDAXIm, HSI50, NI225; ~6months |
||
   market accuracy  positive samples
0  XAUUSD     9.8%                37
1  EURUSD     7.9%                 5
2  GBPUSD      13%                16
3  USDCAD      11%                 8
4  USDJPY     7.5%                 3
5  FCHI40     9.6%                45
6  GDAXIm    11.9%                41
7   HSI50    11.8%                32
8   NI225    11.1%                43
9  SP500m    10.3%                46
Accuracy stats are
        accuracy
count  10.000000
mean    0.103900
std     0.017477
min     0.075000
25%     0.096500
50%     0.106500
75%     0.116250
max     0.130000


Comments
Post a Comment